View Analytics
Click the Analytics  icon in the menu bar.
The Analytics chart displays.
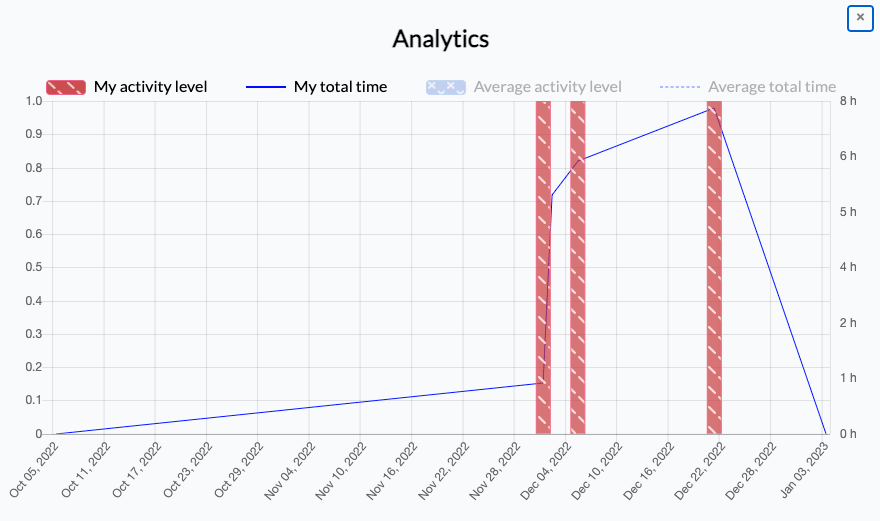
The chart shows a plot of your total time spent in the desktop, as well as activity (keyboard and mouse) statistics.
Click Average activity level and Average total time to see a comparison with My activity level and My total time.